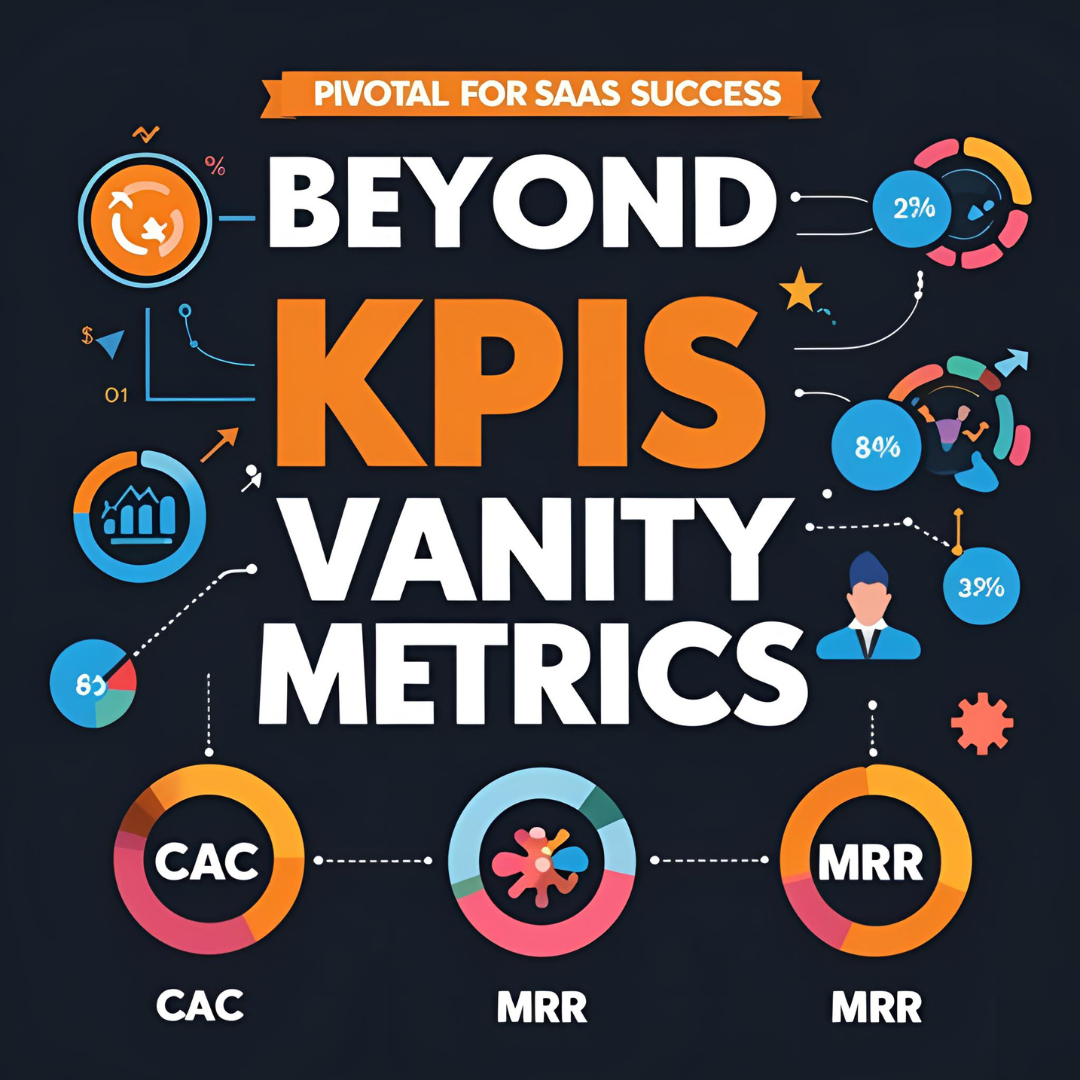
Beyond Vanity Metrics: 7 KPIs That Actually Predict SaaS Success
The metrics that matter for SaaS growth, based on analysis of 35+ successful product launches and extensive client data.
The Problem with Vanity Metrics
Most SaaS founders track the wrong metrics. Page views, social media followers, and even user registrations can be misleading. These vanity metrics make you feel good but don't predict business success.
The 7 KPIs That Actually Matter
1. Monthly Recurring Revenue (MRR) Growth Rate
What it measures: The month-over-month percentage increase in recurring revenue.
Why it matters: This is the ultimate measure of business health. Aim for 15-20% monthly growth in early stages.
How to calculate: (Current Month MRR - Previous Month MRR) / Previous Month MRR × 100
2. Customer Acquisition Cost (CAC)
What it measures: The total cost to acquire one paying customer.
Why it matters: If CAC is higher than Customer Lifetime Value (CLV), your business model is broken.
Benchmark: CAC should be less than 1/3 of CLV for sustainable growth.
3. Churn Rate
What it measures: The percentage of customers who cancel their subscription each month.
Why it matters: High churn indicates product-market fit issues. Even small improvements in churn have massive impact on growth.
Target: Aim for less than 5% monthly churn for B2B SaaS, less than 10% for B2C.
4. Net Revenue Retention (NRR)
What it measures: Revenue retention from existing customers, including expansions and upgrades.
Why it matters: NRR above 100% means you're growing revenue even without new customers.
Benchmark: Top SaaS companies achieve 110-130% NRR.
5. Time to Value (TTV)
What it measures: How long it takes new users to experience their first success with your product.
Why it matters: Shorter TTV leads to better activation rates and lower churn.
Target: Aim for users to see value within their first session.
6. Product Qualified Leads (PQL) Conversion Rate
What it measures: Percentage of trial users who convert to paying customers.
Why it matters: This indicates product-market fit better than any other metric.
Benchmark: Good SaaS products see 15-25% trial-to-paid conversion rates.
7. Feature Adoption Rate
What it measures: Percentage of users actively using key features.
Why it matters: Users who adopt core features are less likely to churn and more likely to upgrade.
Action: Focus development on features with high adoption and business impact.
How to Track These Metrics
Essential Tools
- Analytics: Mixpanel, Amplitude, or Google Analytics 4
- Revenue: Stripe, ChartMogul, or ProfitWell
- User Behavior: Hotjar, FullStory, or LogRocket
- Customer Success: Intercom, Zendesk, or HubSpot
Dashboard Setup
Create a weekly dashboard that shows:
- MRR and growth rate
- New customers and CAC
- Churn rate and reasons
- Feature adoption trends
Common Mistakes to Avoid
1. Tracking Too Many Metrics
Focus on 3-5 key metrics that directly impact your business goals. Too many metrics lead to analysis paralysis.
2. Not Segmenting Data
Always segment metrics by customer type, acquisition channel, and user behavior. Averages can be misleading.
3. Ignoring Leading Indicators
Revenue is a lagging indicator. Track leading indicators like trial signups, feature adoption, and user engagement.
Taking Action on Your Metrics
Metrics are only valuable if they drive action. Set up weekly reviews to:
- Identify trends and anomalies
- Investigate root causes
- Plan experiments and improvements
- Measure impact of changes
Need Help Setting Up Analytics?
We can help you implement proper analytics and tracking for your SaaS product.
Book Free Agent Demo